// product · available now
Grafana Dashboard Pack
for Kubernetes & Prometheus
Production-ready Grafana dashboards for Prometheus, node_exporter and Kubernetes. Import in minutes or deploy as code.
● instant download · secure checkout by Gumroad
// tested
Tested, not just exported
Every release runs against a real Grafana + Prometheus stack before it ships.
Every panel query checked against a live Prometheus — 0 query errors
File provisioning tested on clean Grafana 10.4 and 11.1
Terraform applied against a real Grafana; Helm values rendered with kube-prometheus-stack
Prometheus rules validated with promtool
// screenshots
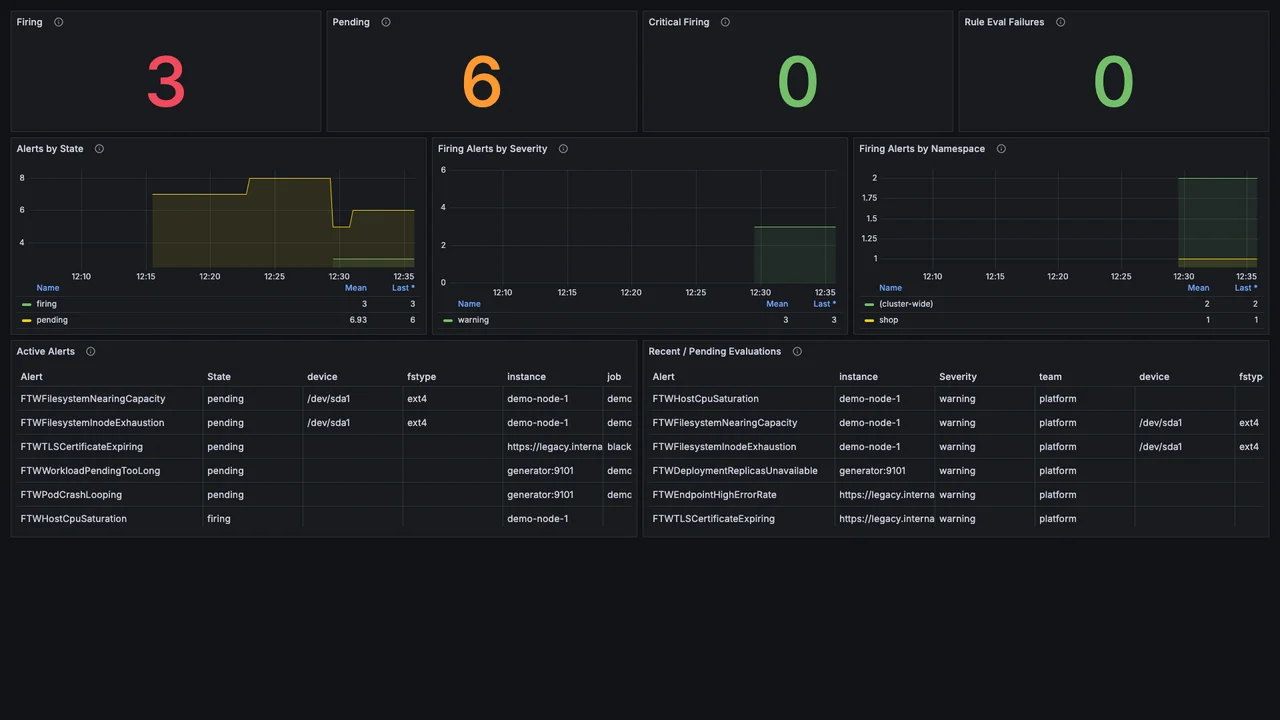
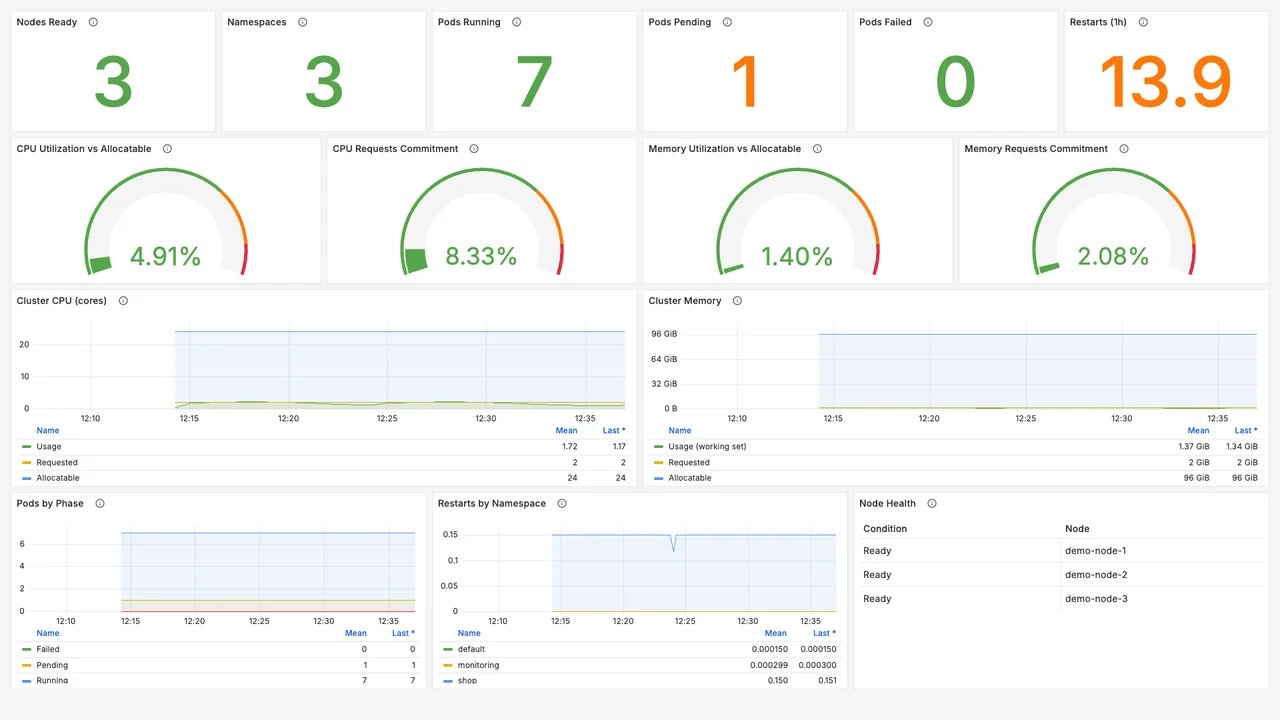
What you get
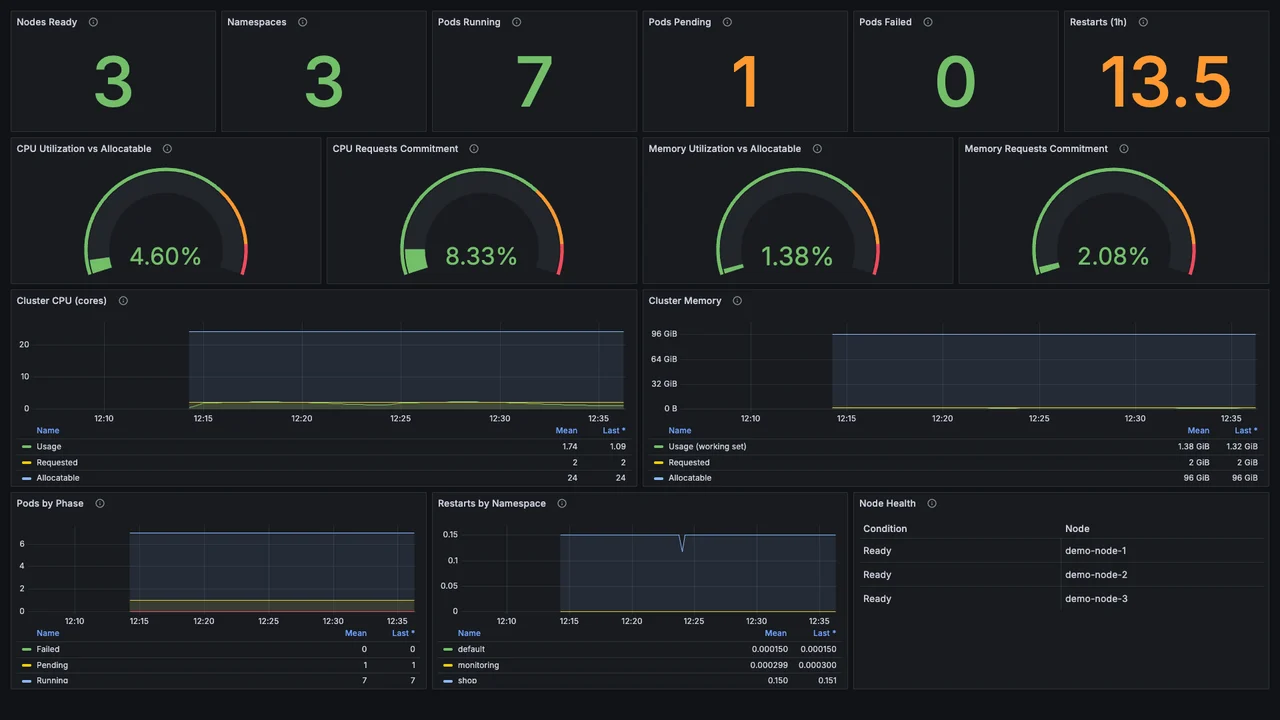
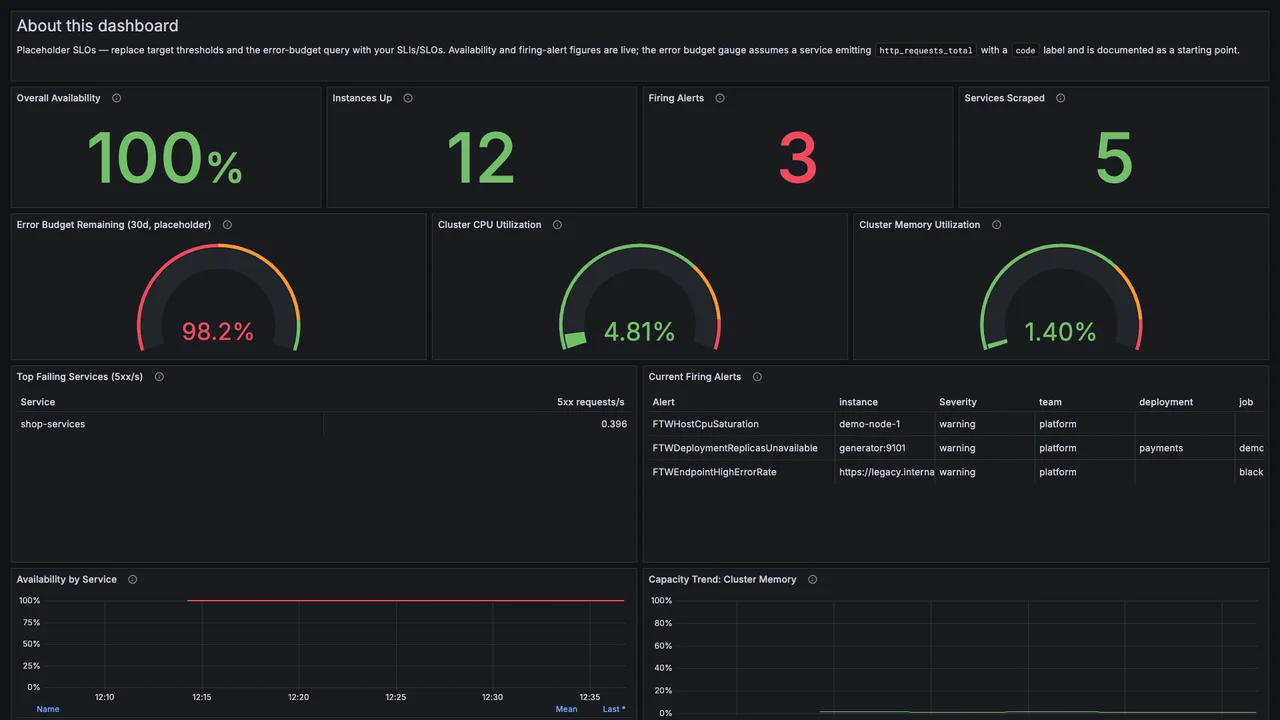
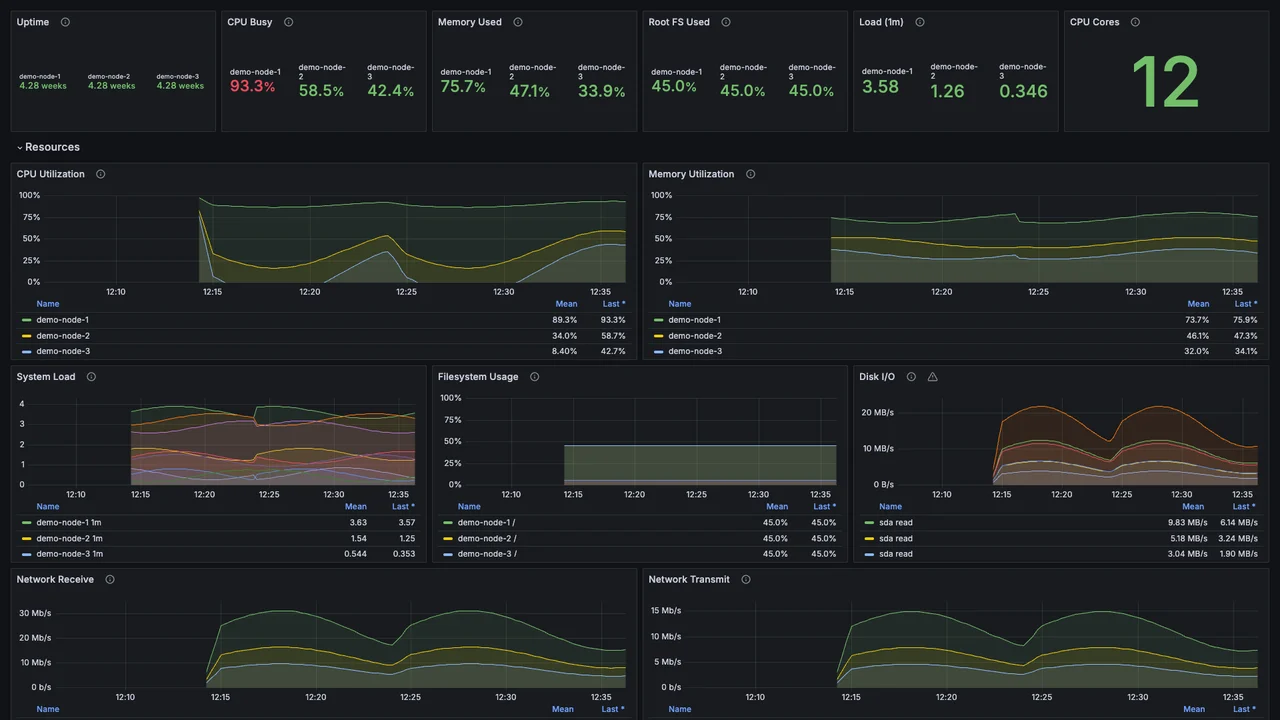
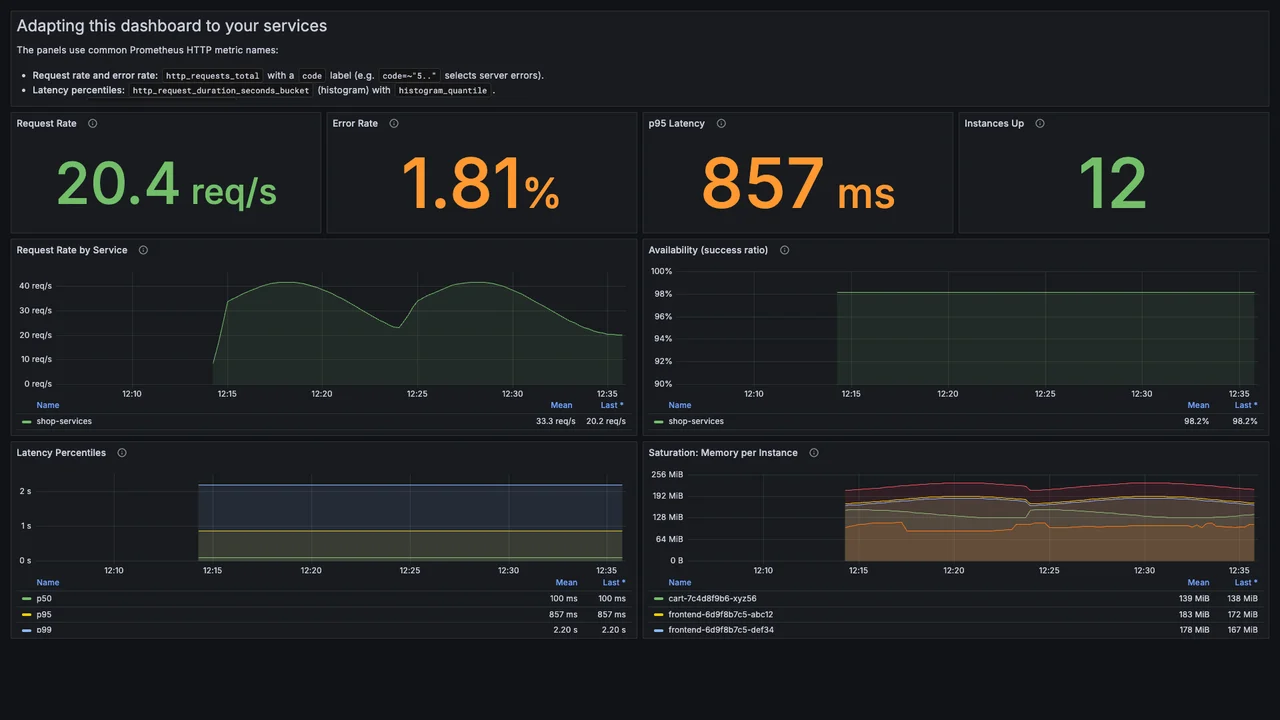
Real captures on synthetic demo metrics — the Studio tier ships the same demo stack.
// pricing
One-time purchase, three tiers
Pay once, keep the files. Each tier includes everything in the tier before it.
Starter
Hobbyists, homelabs, solo developers
$9USD
- 2 host dashboards: Infrastructure Overview, Node Exporter Details
- Import guide, compatibility matrix, troubleshooting basics
- 30 days of updates
Pro
DevOps engineers and small teams
$39USD
- 8 dashboards: hosts + Kubernetes cluster, nodes, workloads, namespaces & pods
- Application / Service Overview (RED) and Blackbox endpoints
- 12 Prometheus alert rules + 4 recording rules, Grafana alert examples
- Data source & dashboard provisioning files
- 1 year of updates
Studio
Consultants, agencies, production teams
$79USD
- All 13 dashboards incl. SRE summary, container deep dive, Loki logs, alert operations, capacity planning
- Terraform, Helm (kube-prometheus-stack) and alerting provisioning
- Docker demo stack with synthetic metrics
- Implementation runbook, upgrade guide, client-use license
- 1 year of updates
// dashboards
13 dashboards
- Infrastructure OverviewStarter+
- Node Exporter DetailsStarter+
- Kubernetes Cluster OverviewPro+
- Kubernetes NodesPro+
- Kubernetes WorkloadsPro+
- Kubernetes Namespaces & PodsPro+
- Application / Service Overview (RED)Pro+
- Blackbox Endpoint MonitoringPro+
- SRE / Executive SummaryStudio+
- Container & Runtime Deep DiveStudio+
- Loki Logs OverviewStudio+
- Alert OperationsStudio+
- Capacity PlanningStudio+
// compatibility
Works with your stack
- Grafana OSS / Enterprise / Cloud 10.x & 11.x
- Prometheus, Mimir, Thanos, VictoriaMetrics
- kube-prometheus-stack
- node_exporter · kube-state-metrics · cAdvisor
- blackbox_exporter
- Loki (optional, Studio)
// faq
Questions
+Will these work with my data source name?
Yes. Every dashboard uses a DS_PROMETHEUS variable — pick your data source on import. Nothing is hard-coded.
+Do I need Kubernetes?
No. Starter and the host dashboards only need node_exporter. The Kubernetes dashboards need kube-state-metrics and cAdvisor, both included in kube-prometheus-stack.
+Why would a panel say “No data”?
Almost always a missing exporter or a label mismatch. Every tier ships a metric-requirements list and troubleshooting steps.
+Can I use it for client work?
Starter and Pro are licensed for your own organization. Client and agency deployments require Studio.
+How do I receive the files?
Checkout runs on Gumroad. You get an instant download link by email and in your Gumroad library, including future updates.
+Refunds?
If the dashboards don't work with a supported setup and the troubleshooting guide doesn't fix it, contact us within 14 days for a refund.
Skip the weekend of dashboard building.
Questions first? Email hello@fractaltechware.com