// product · available now
Prometheus Alert Rules Pack
tested alerts + runbooks for Kubernetes, hosts & databases
Prometheus alert rules that are actually tested: every alert ships with promtool unit tests, a runbook and sane for: durations.
● instant download · secure checkout by Gumroad
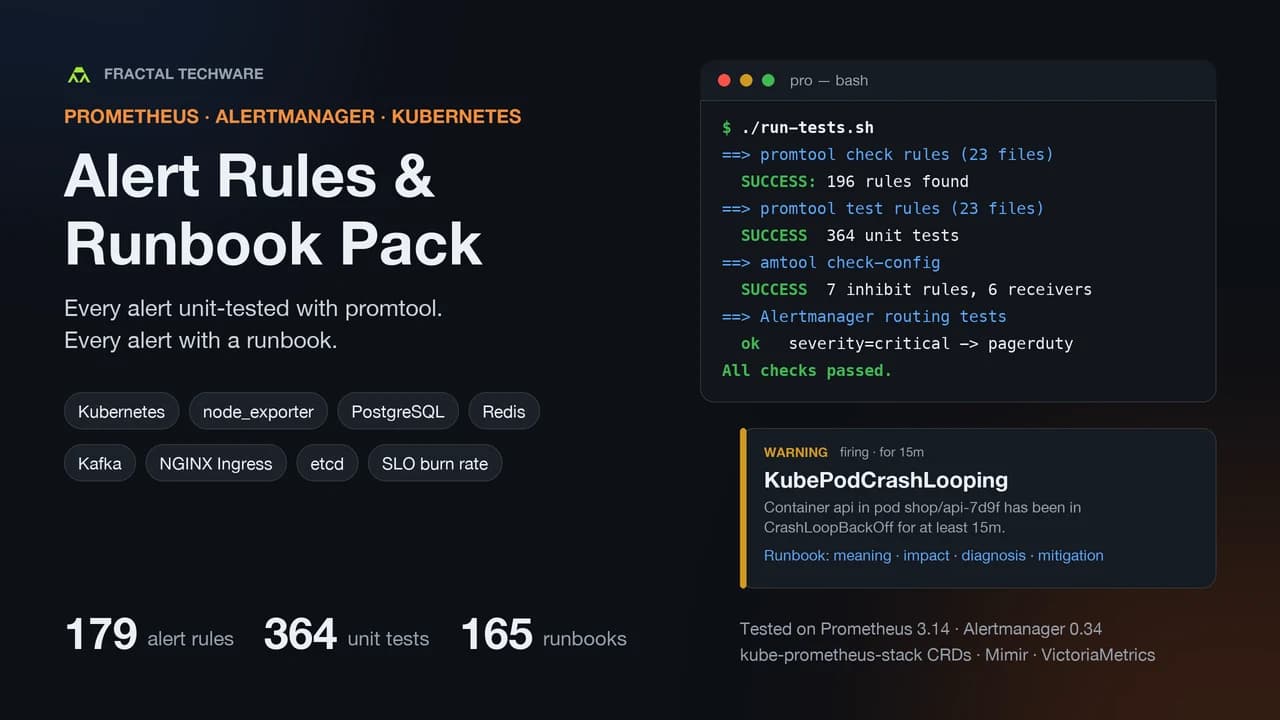
// tested
Tested, not just written
Every release runs its full test suite against real tooling before it ships.
364 promtool unit tests: every alert proven to fire, and to stay quiet on healthy data
Loaded into a live Prometheus 3.14: all 23 rule groups healthy
Metric names checked against real node_exporter, blackbox_exporter, Prometheus and Alertmanager
Alertmanager config validated with amtool; routing tests and live inhibition check
PrometheusRule CRDs validated against the prometheus-operator schema
Current metric names: kube-state-metrics v2, node_exporter 1.x, Prometheus 3.x
// pricing
One-time purchase, three tiers
Pay once, keep the files. Each tier includes everything in the tier before it.
Starter
Kubernetes and Linux host operators
$19USD
- 49 alert rules: Kubernetes workloads, nodes and Linux hosts
- 98 promtool unit tests, one runbook per alert
- run-tests.sh, docker-compose trial stack, install guide
- 30 days of updates
Pro
SRE and platform teams on kube-prometheus-stack
$49USD
- 179 alert rules across 20 domains + 17 recording rules, 364 unit tests
- Control plane, storage, PostgreSQL, Redis, NGINX Ingress, Kafka, Loki, CoreDNS, etcd
- SLO multi-window multi-burn-rate alerts
- PrometheusRule CRDs and Alertmanager config with routing tests
- 1 year of updates
Studio
Consultants, agencies, multi-cluster teams
$99USD
- Generator: thresholds, labels, namespaces and runbook URLs from one overrides file
- Slack, PagerDuty, email and Microsoft Teams templates
- kube-prometheus-stack Helm values, HTML runbook site
- Client-use license
- 1 year of updates
// contents
20 alerting domains
- Kubernetes workloadsStarter+
- Kubernetes nodes & capacityStarter+
- Linux hosts (node_exporter)Starter+
- Storage, Jobs, HPA, quotas, PDBsPro+
- Control plane, kubelet & certificatesPro+
- Prometheus & Alertmanager + WatchdogPro+
- Blackbox probes & TLS expiryPro+
- PostgreSQL · Redis · KafkaPro+
- NGINX Ingress · CoreDNS · etcd · LokiPro+
- SLO burn-rate alertsPro+
- Overrides generatorStudio+
- Notification templates + Helm valuesStudio+
// compatibility
Works with your stack
- Prometheus 2.42+ and 3.x, Alertmanager 0.28+
- kube-prometheus-stack / prometheus-operator
- Grafana Mimir & Grafana Cloud, Thanos, VictoriaMetrics
- EKS, GKE, AKS, k3s, self-managed Kubernetes
- Linux hosts with node_exporter
// faq
Questions
+How is this different from awesome-prometheus-alerts?
Those are a great reference but untested snippets. Here every rule has unit tests, a runbook, consistent labels and annotations, tuned for: durations, and warning/critical variants with inhibition.
+Will the alerts fire in my setup?
Defaults match kube-prometheus-stack job names. The compatibility matrix lists every expected job and exporter version, and run-tests.sh proves the logic on your machine in one command.
+Will I get duplicates with kube-prometheus-stack's default rules?
The install guide lists the chart's rule groups to disable; Studio's Helm values do it for you.
+Can I use it for client work?
Starter and Pro are licensed for your own organization. Client and agency use requires Studio.
+Refunds?
If the rules don't work with a supported setup and the troubleshooting guide doesn't fix it, contact us within 14 days for a refund.
Know which alerts fire before production tells you.
Questions first? Email hello@fractaltechware.com