// product · available now
Single-VPS Observability Stack
Prometheus, Grafana, Loki & Tempo behind HTTPS
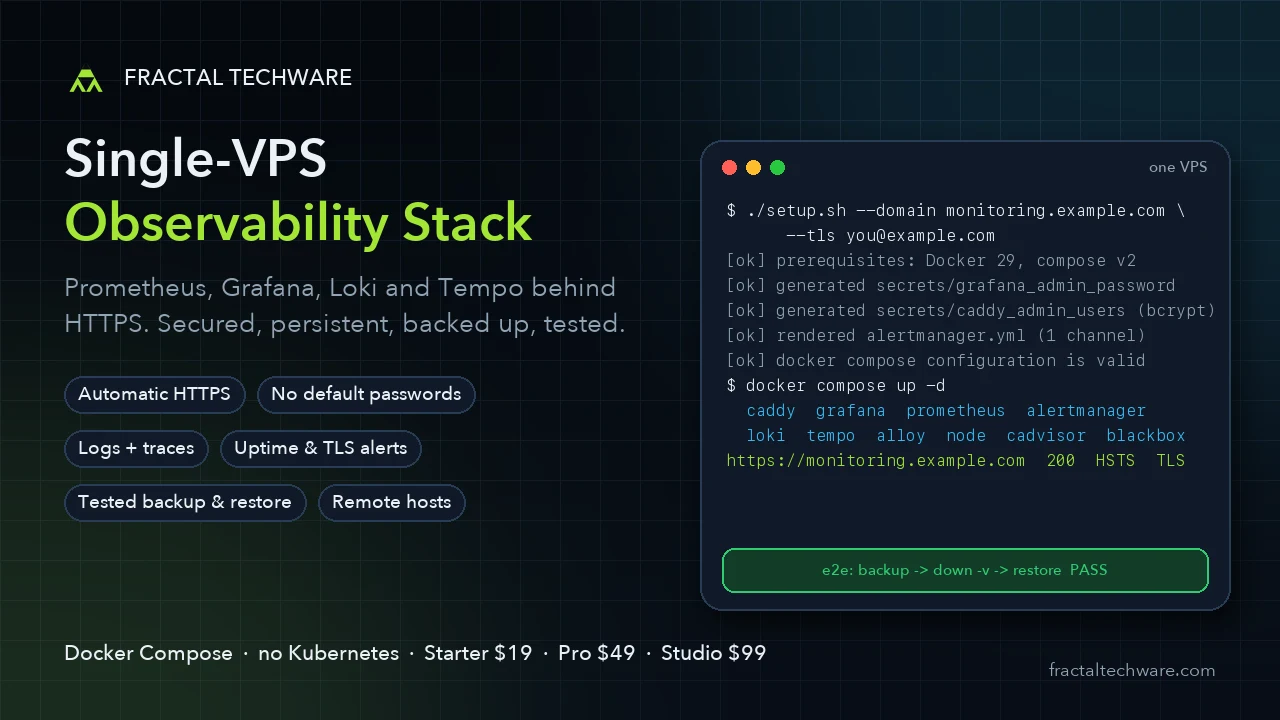
One docker compose up gives you a secured, persistent, backed-up observability stack on a single VPS — no Kubernetes.
● instant download · secure checkout by Gumroad
// tested
Tested, not just written
Every release runs its full test suite against real tooling before it ships.
HTTPS through Caddy with the certificate chain verified
Grafana rejects admin/admin and accepts only the generated password; Prometheus is 401 without basic auth
Every scrape target up, every alert rule evaluating, every dashboard panel query returning data
A real alert travels Prometheus → Alertmanager → receiver on every release
Pro: backup → docker compose down -v → restore, with dashboards, metric history and logs all back
Studio: full disaster recovery from an empty directory and off-host restic storage
// pricing
One-time purchase, three tiers
Pay once, keep the files. Each tier includes everything in the tier before it.
Starter
Indie SaaS and small teams on one server
$19USD
- Prometheus, Alertmanager, node_exporter, cAdvisor, Grafana behind Caddy
- setup.sh generates passwords and bcrypt hashes; no default credentials
- 3 dashboards, 19 tested alerts, retention by time and size
- Healthchecks, resource limits, log rotation
- 30 days of updates
Pro
Teams that need logs, traces and real backups
$49USD
- Loki + Alloy (Docker and host logs) and Tempo with OTLP receivers
- Data sources correlated both ways: log line → trace, span → logs
- Uptime and TLS-expiry checks, alerts to webhook, e-mail, Slack, Telegram
- backup.sh / restore.sh with optional encrypted off-host copy
- Authenticated ingest + agent for your other servers, 1 year of updates
Studio
Agencies and consultants running fleets
$99USD
- Grafana SSO (GitHub, Google, authentik) with role mapping
- Per-host ingest credentials, multi-host inventory, public status page
- Off-host restic backups with retention and integrity checks
- Executed disaster-recovery runbook, sizing guide, cloud-init bootstrap
- Client-use license, 1 year of updates
// contents
What's inside
- Prometheus + Alertmanager + GrafanaStarter+
- Caddy with automatic HTTPSStarter+
- node_exporter + cAdvisorStarter+
- 3 dashboards, 19 tested alertsStarter+
- Loki + Alloy (logs)Pro+
- Tempo + OTLP (traces)Pro+
- Uptime & TLS-expiry checksPro+
- backup.sh / restore.shPro+
- Remote host agentPro+
- Grafana SSO + status pageStudio+
- Off-host restic backupsStudio+
- cloud-init bootstrap + sizing guideStudio+
// compatibility
Works with your stack
- Any Linux VPS with Docker (Hetzner, DigitalOcean, Vultr, Scaleway, OVH, Lightsail)
- Ubuntu 24.04 · Debian · amd64 and arm64
- Docker Compose v2 · Let's Encrypt / ZeroSSL
- Any app that speaks OTLP
- S3-compatible object storage for backups
// faq
Questions
+Do I need Kubernetes?
No. This is a single VPS with Docker Compose. If you run Kubernetes, the Hardening Kit and OpenTelemetry packs fit better.
+Will it run on a 2 GB VPS?
Starter yes. Pro (logs and traces too) is comfortable at 4 GB, and Studio ships a sizing guide with the retention math.
+Can I monitor more than one server?
Yes, from Pro on: the remote agent pushes metrics and logs over HTTPS with basic auth. Studio adds one credential per host that you can rotate or revoke instantly.
+How are the backups verified?
The release suite creates a dashboard, backs up, destroys every volume, restores, then checks the dashboard, the metric history at its original timestamps and the logs are back.
+Can I use it for client work?
Starter and Pro are licensed for your own organization. Client and agency use requires Studio.
+Refunds?
If the stack doesn't come up on a supported Docker version and the troubleshooting guide doesn't fix it, contact us within 14 days for a refund.
Your own observability stack, up this afternoon.
Questions first? Email hello@fractaltechware.com